The Unpivot node is used to convert cross tabulated grids (often referred to as "cross-tabs" or matrix grids) into a tabular format, generally referred to as a table or list. Cross tabulation is used to organize and aggregate raw categorical data into a grid format, which is useful for comparing and analyzing data. This type of grid is particularly common when working in Excel, where users can easily create cross tabulated grids and pivot tables.
However, this kind of data structure is not supported for data modeling and querying in tools like Pyramid, which require a tabular data structure. If your data source contains cross tabulated grids, as is often the case with Excel data sources, you'll need to convert these to a tabular structure. This is done using the Unpivot node, which denotes the categorical columns and measure columns in the grid.
Unpivoting a Table
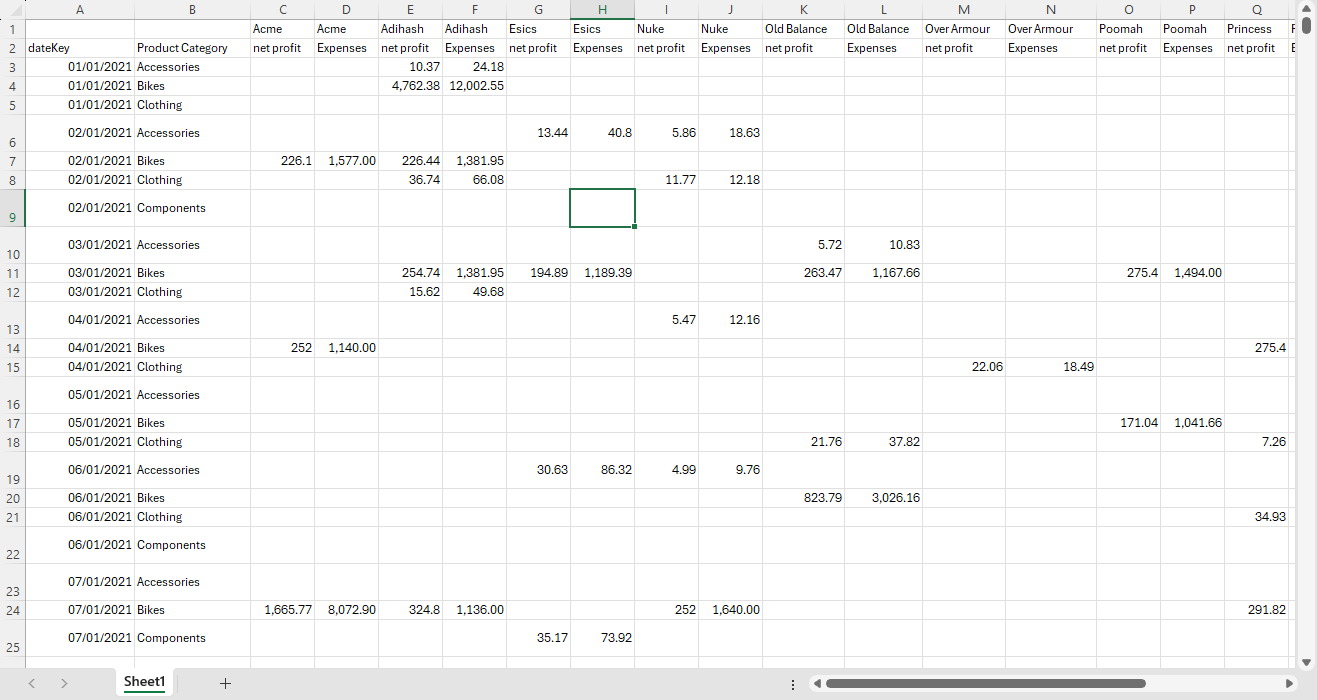
Here we have a spreadsheet containing a matrix grid:
Step 1: Connect the Unpivot Node
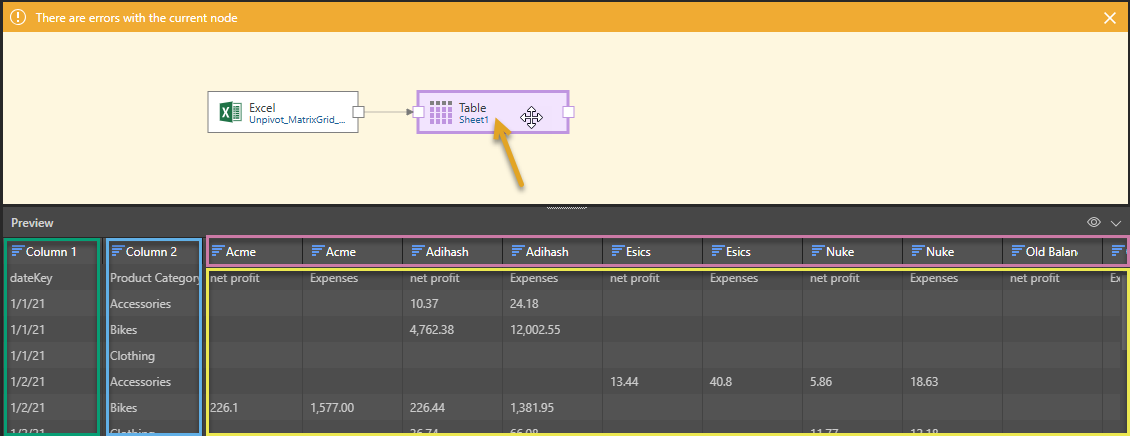
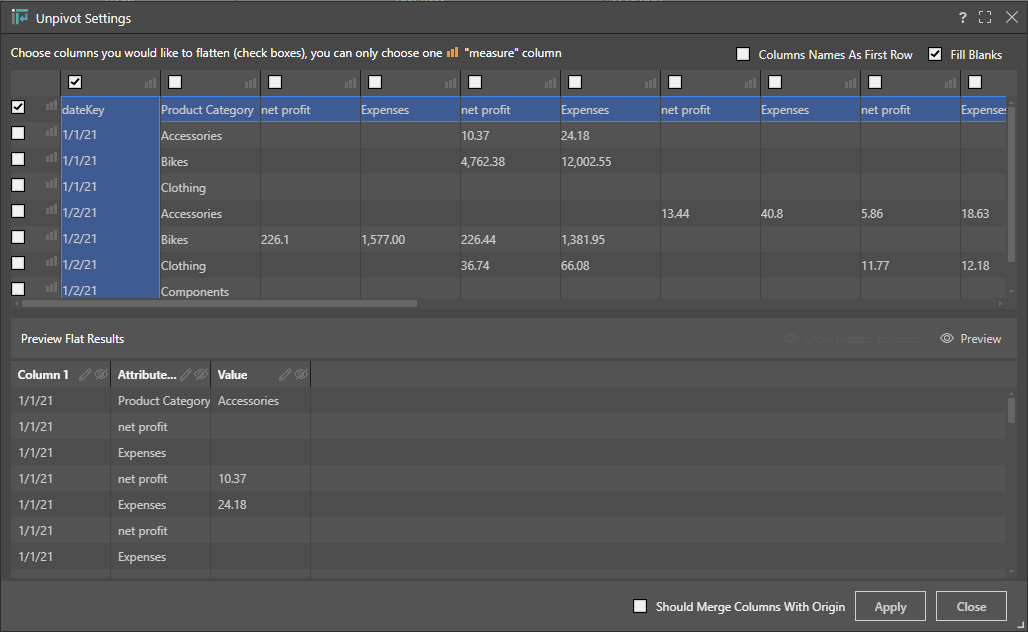
When the table is configured in the Data Flow, we see in the Preview panel that the table's structure is not logical. The headers and values in the cross-tab grid are displayed in a tabular format, without having been restructured:
It's clear that the table, if left as is, cannot be queried. To make the table useable, we will need to make the following changes:
- The headers including the manufacturer names (purple highlight above) need to be reorganized into a tabular column.
- The two measures, net profit and expenses (yellow highlight), need to be converted into two tabular columns.
- Column 1 (green highlight) should be organized into a tabular column called Date Key and the first row in the column should be assigned as the column's header.
- Column 2 (blue highlight) should be organized into a tabular column called Product Category and the first row in the column should be assigned as the column's header.
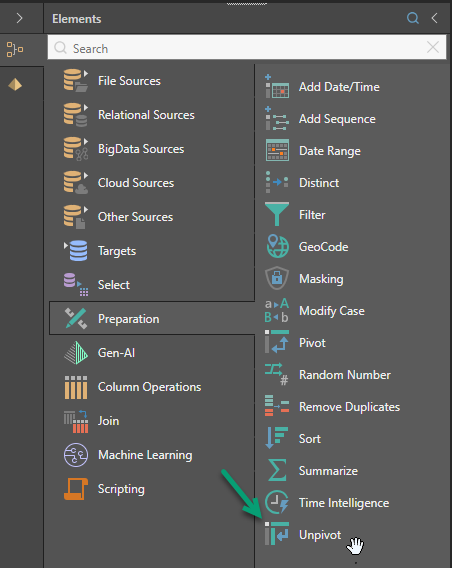
To convert the cross-tab grid into a tabular format, the Unpivot node must be added. Find the Unpivot node in the Preparations tab and drag it onto the canvas:
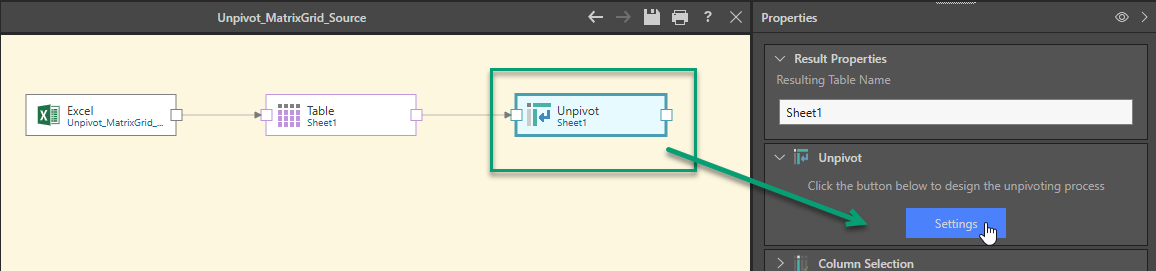
Connect the table node containing the matrix grid to the Unpivot node, and, with the Unpivot node selected, click Settings in the Properties panel to open the Unpivot Settings dialog:
Step 2: Configure the Unpivot Settings
In the Unpivot Settings dialog, select the rows and columns that should be converted into columns:
Column Names As First Row
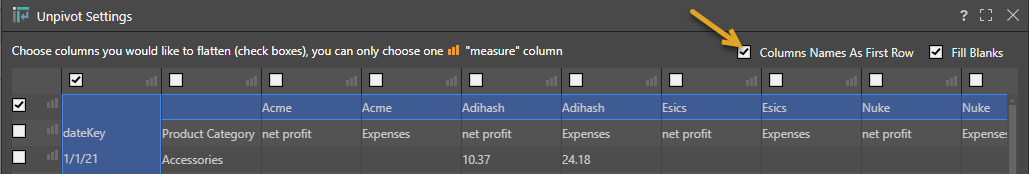
If the first row in the cross-tab grid contains column headers (as in this example), select the Column Names as First Row checkbox (orange arrow below). This moves the values in the first row to the column headers.
Fill Blanks
At the top-right of the panel, selected by default, is the Fill Blanks checkbox. Select this option to automatically fill any empty cells in the fixed columns (the columns that are not subject to the unpivot action) with the value from the preceding cell; for example, where a cell with the Date Key 1/1/21 is followed by an empty cell, 1/1/21 is copied into the empty cell.
Convert Categorical Data to Tabular Columns
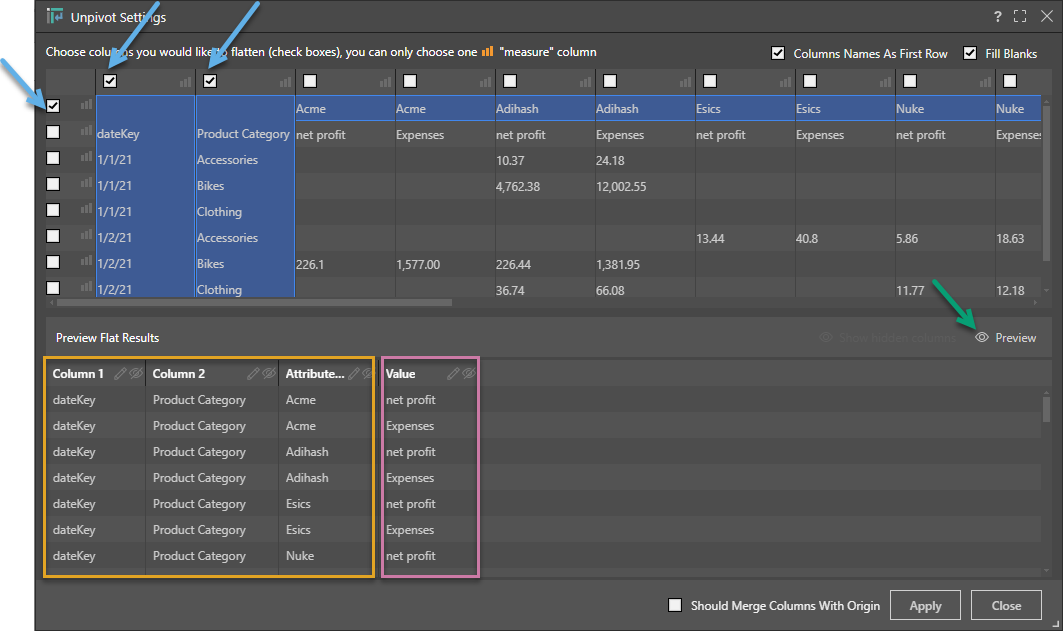
In this example, we have two columns that are “row headers” in the cross-tab format: dateKey and Product Category. These are the two left-most selected columns, shaded in blue in the image below. These both need to be converted to columns, as does the row containing manufacturer headers. To convert this categorical data into tabular columns, select the corresponding checkbox (blue arrows below).
Click Preview (green arrow) to preview the results.
In the results preview, we see three tabular columns for dateKey, Product Category, and Manufacturer (orange highlight). We also see a Value column containing the Expenses and Net Profit headers (purple highlight); these values must be converted into columns.
Convert Values to Tabular Columns
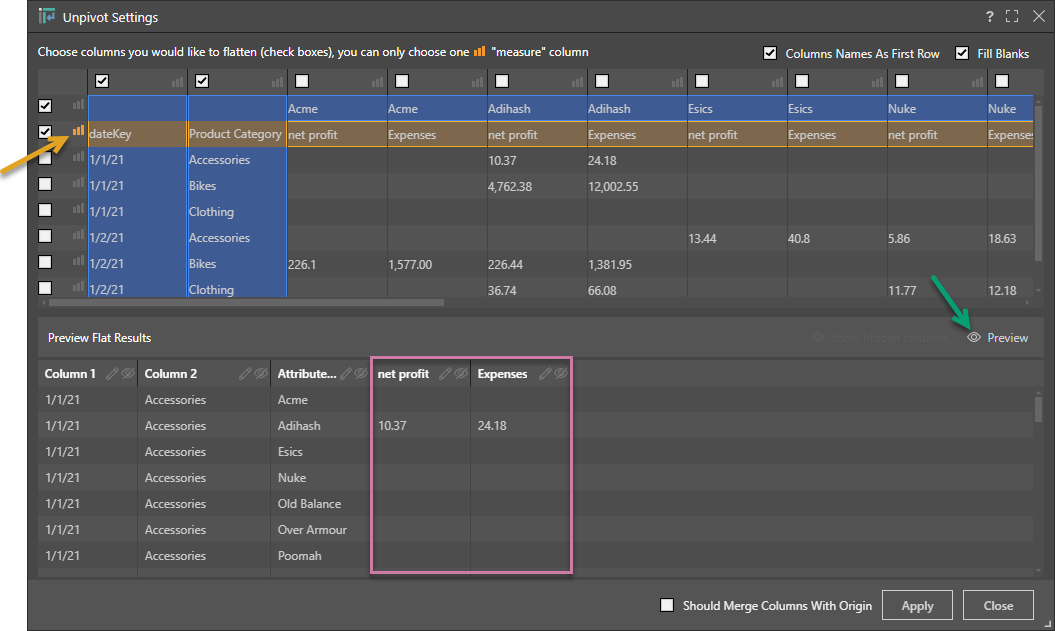
To convert the values into columns, find the value headers and click the corresponding measure icon (orange arrow below) to select the row or column. Click the preview button again (green arrow) to see the updated preview with the value columns (purple highlight):
Step 3: Change Column Names and Hide Columns
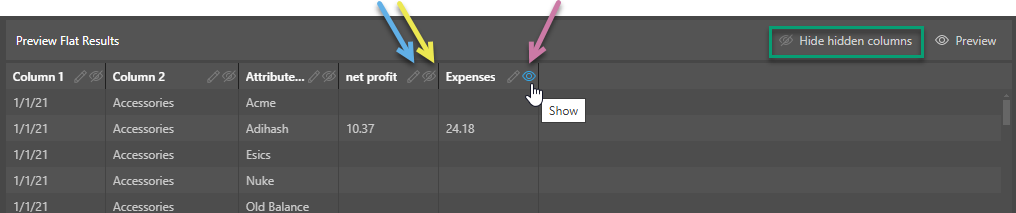
From the Preview Flat Results panel, you can use the following icons on the column headers:
- To change the column name (make Column 1 into Date Key, for example) click Edit (blue arrow below) and type your new name into the header.
- To hide the column, click Hide (yellow arrow).
- To show the column, click Show (purple arrow).
Use the Show hidden columns and Hide hidden columns buttons to show or show or hide hidden columns in this panel. This button is only enabled when there are hidden columns in the Preview.
Note: The Show hidden columns option shows the hidden columns here, but does not un-hide them. If you want to "un-hide" a hidden column, you need to click Show hidden columns and then click the Show icon (purple arrow) in the hidden column.
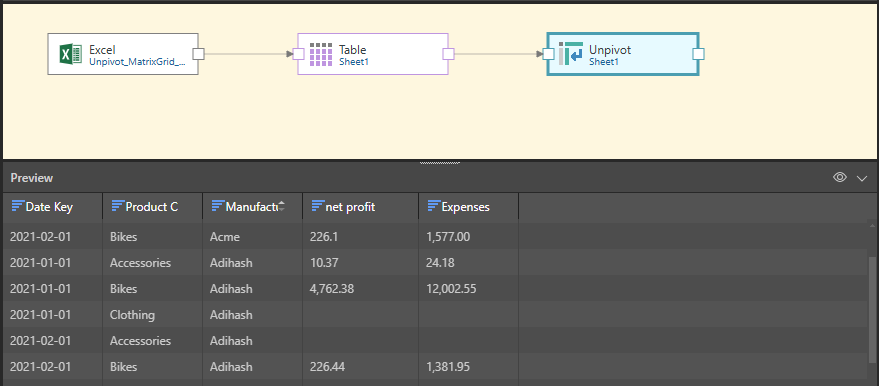
Step 4: Apply Changes and Preview the Unpivoted Table
Be sure to click the Apply button to confirm your unpivot settings.
Preview the Unpivot node in the Data Flow to see the tabular structure of the unpivoted table:
Related information
Common Properties
There are a number of fields that are present in the Properties panel when you have any of the preceding nodes selected on the canvas. These fields include Result Properties, Column Selection, Set Variable Values, and Metadata.
- Click here for more details about the Common Properties